Home /
Expert Answers /
Electrical Engineering /
problem-1-the-following-block-flow-diagram-represents-a-closed-loop-process-using-a-pi-controller-pa192
(Solved): Problem 1) The following block flow diagram represents a closed loop process using a PI controller ...
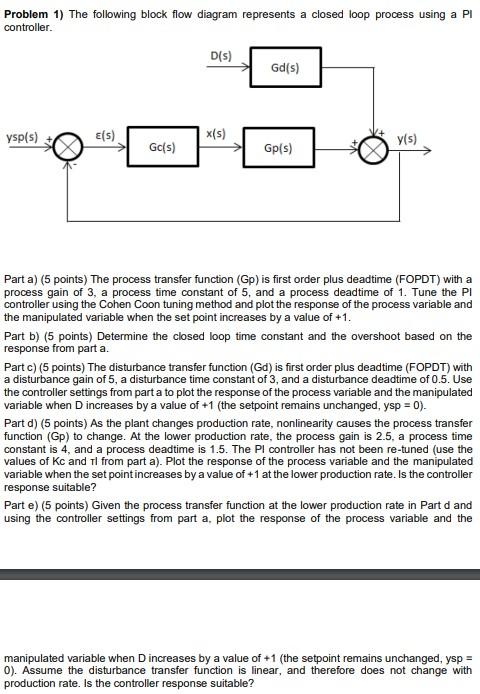
Problem 1) The following block flow diagram represents a closed loop process using a PI controller. D(S) Gd(s) ysp(s) ?(s), x(s) Gc(s) Gpls) y(s) Part a) (5 points) The process transfer function (GP) is first order plus deadtime (FOPDT) with a process gain of 3, a process time constant of 5, and a process deadtime of 1. Tune the PI controller using the Cohen Coon tuning method and plot the response of the process variable and the manipulated variable when the set point increases by a value of +1. Part b) (5 points) Determine the closed loop time constant and the overshoot based on the response from part a. Partc) (5 points) The disturbance transfer function (Gd) is first order plus deadtime (FOPDT) with a disturbance gain of 5, a disturbance time constant of 3, and a disturbance deadtime of 0.5. Use the controller settings from part a to plot the response of the process variable and the manipulated variable when Dincreases by a value of +1 (the setpoint remains unchanged, ysp = 0). Part d) (5 points) As the plant changes production rate, nonlinearity causes the process transfer function (p) to change. At the lower production rate, the process gain is 2.5. a process time constant is 4, and a process dead time is 1.5. The Pl controller has not been re-tuned (use the values of Kc and Tl from part a). Plot the response of the process variable and the manipulated variable when the set point increases by a value of +1 at the lower production rate. Is the controller response suitable? Parte) (5 points) Given the process transfer function at the lower production rate in Part d and using the controller settings from part a. plot the response of the process variable and the manipulated variable when D increases by a value of +1 (the setpoint remains unchanged, ysp = 0). Assume the disturbance transfer function is linear, and therefore does not change with production rate. Is the controller response suitable?
