Home /
Expert Answers /
Economics /
attempt-3-6-out-of-11-parts-have-been-answered-correctly-the-table-below-shows-cost-data-for-prod-pa581
(Solved): Attempt 3: 6 out of 11 parts have been answered correctly. The table below shows cost data for prod ...
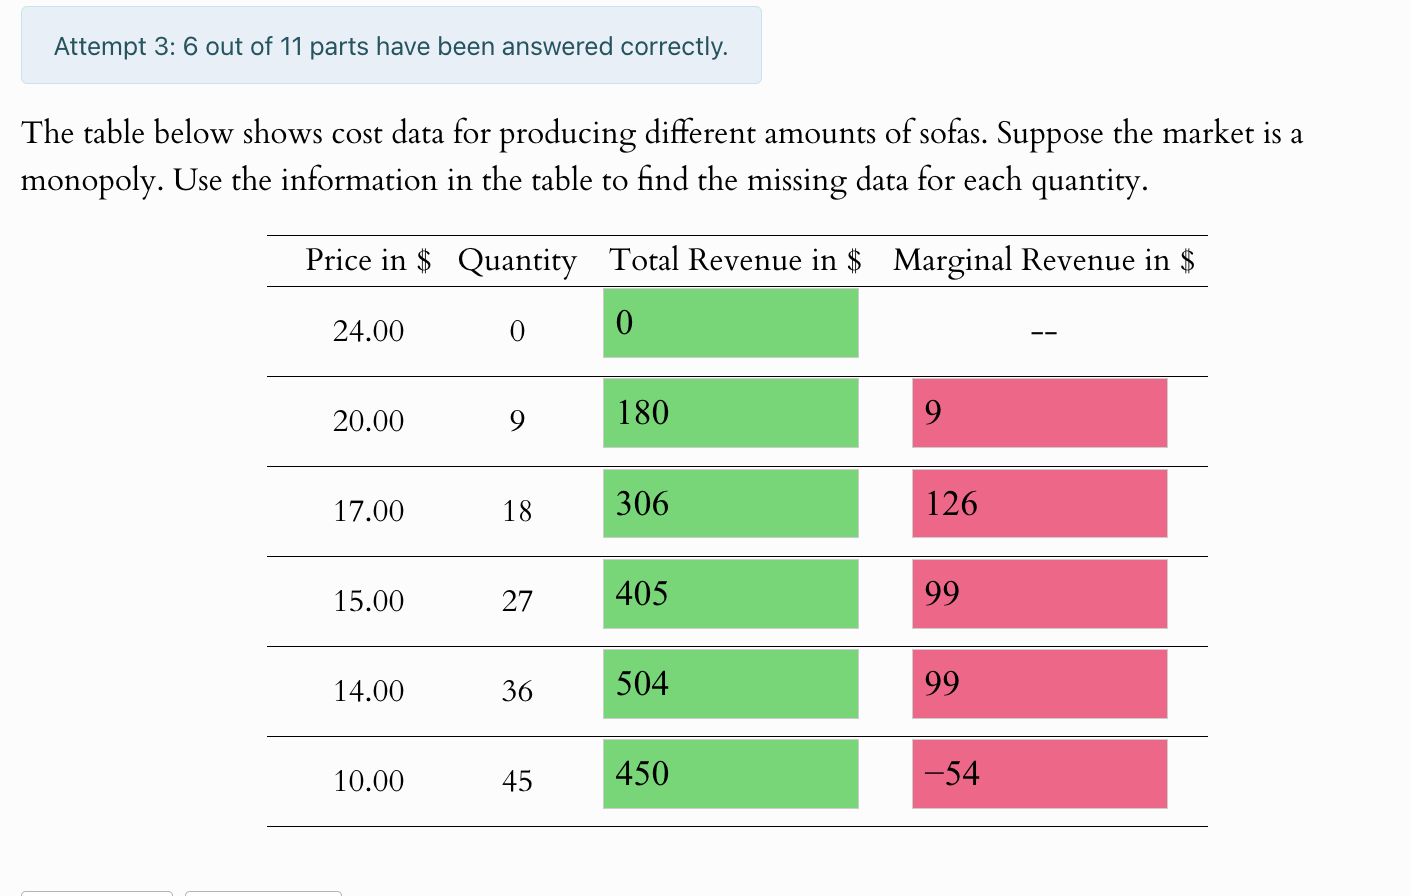
Attempt 3: 6 out of 11 parts have been answered correctly.

The table below shows cost data for producing different amounts of sofas. Suppose the market is a monopoly. Use the information in the table to find the missing data for each quantity.
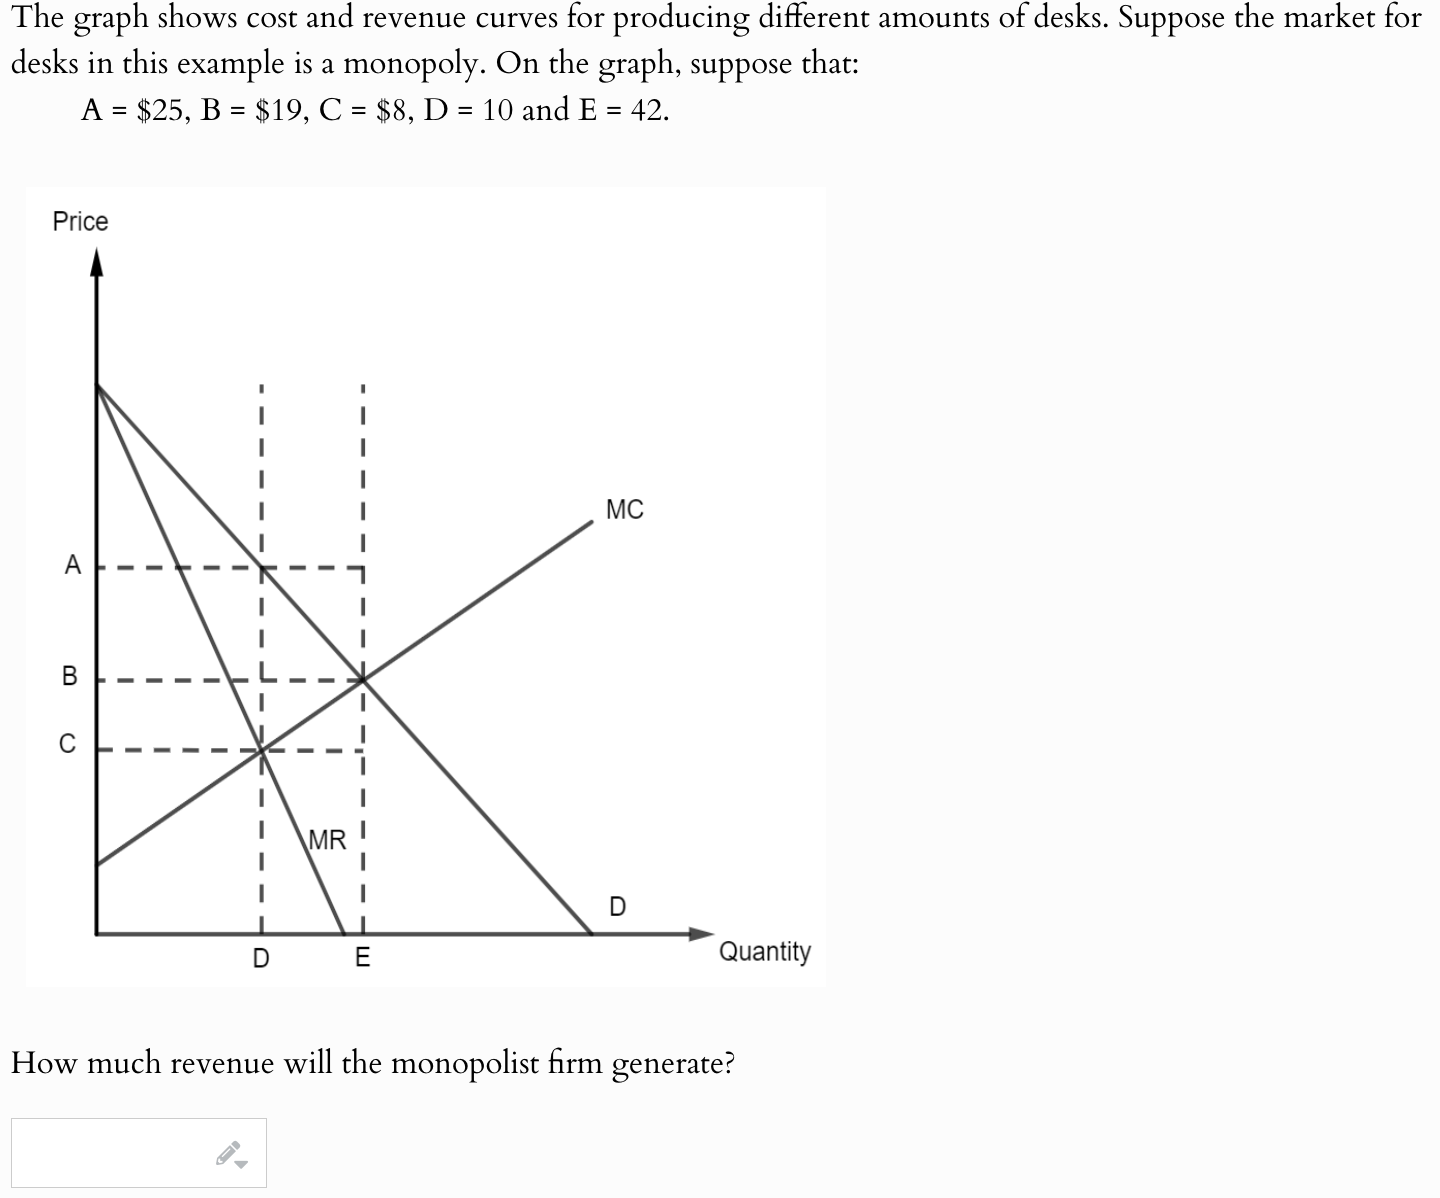
The graph shows cost and revenue curves for producing different amounts of desks. Suppose the market for
desks in this example is a monopoly. On the graph, suppose that:
A=$25,B=$19,C=$8,D=10 and E=42
How much revenue will the monopolist firm generate?
